
Background
I am proud to say that I work in a team where we follow Test Driven Development and pair programming. This has been a life changing experience for me as for several years, I had been writing code first and only writing tests after I thought it was doing what it meant to be doing which often lead to tests that only tested the bare minimum or lead to poorly thought out code that was badly coupled. However, since the last quarter of 2020, I have been practicing TDD with my pair programming partner on every new project except for when it came to working on legacy code where it would take us, much longer to refactor and make the code testable in the first place.
It is often a fine balance, a pragmatic decision we make, based on business priorities and timelines to ensure we do not compromise on code quality and on our team’s values.
On that note, I have been very lucky for the past year working solely on new and exciting features. Thus we have been very good at sticking to our team values of improving code quality and test coverage throughout development life cycle. This meant, less bugs when our QA’s automation and exploratory tests run and even lesser surprises in production.
But this focus on quality also meant that we have to visualise our progress in terms of test code coverage. We want to know if we are missing some key tests cases, which classes were missing them, and if we were good enough at writing unit tests to cover all significant branches of code or were we being too hasty and forgetting to write tests which could have caused high priority production issues.
Thus we decided to invest some time in figuring out how we could integrate test code coverage reports in our build pipelines.
What is a pipeline?
Before I delve into the details of the test code coverage, I just wanted to make sure you understand what I mean here by pipelines.

The one I am referring to is about a Continuous integration pipeline. I might have covered Continuous Integration in other posts but in simple words:
Continuous integration is the practice where developers in a team, integrate their code changes along with corresponding tests to a source code repository’s main branch as and when they finish working on the smallest independent unit of work. The goal of this frequent integration of changes to the main branch is to avoid merge/integration hell and to enable fast feedback loops; which is facilitated by the automated execution of unit and/or integration tests to ensure existing functionality is not negatively impacted by the introduction of the said change.
I did struggle a bit to put that into two sentences, as you can say by the length of the sentences.

So I think we are on the same page now.
Why test code coverage?
You cannot improve what you cannot measure - Someone important
That quote is attributed to different people when you search online. So I decided, it wasn’t important who said it. What was important was the point that the statement made.
If you need to know where you are going, you need to keep checking at different points whether you are still on track.
You look at a map, you see where you started, you look at where you are heading then after a short while at a pit stop, you do that again, this time you see that you have progressed and you also know if you are still on track or you have accidentally taken the wrong turn along the way.
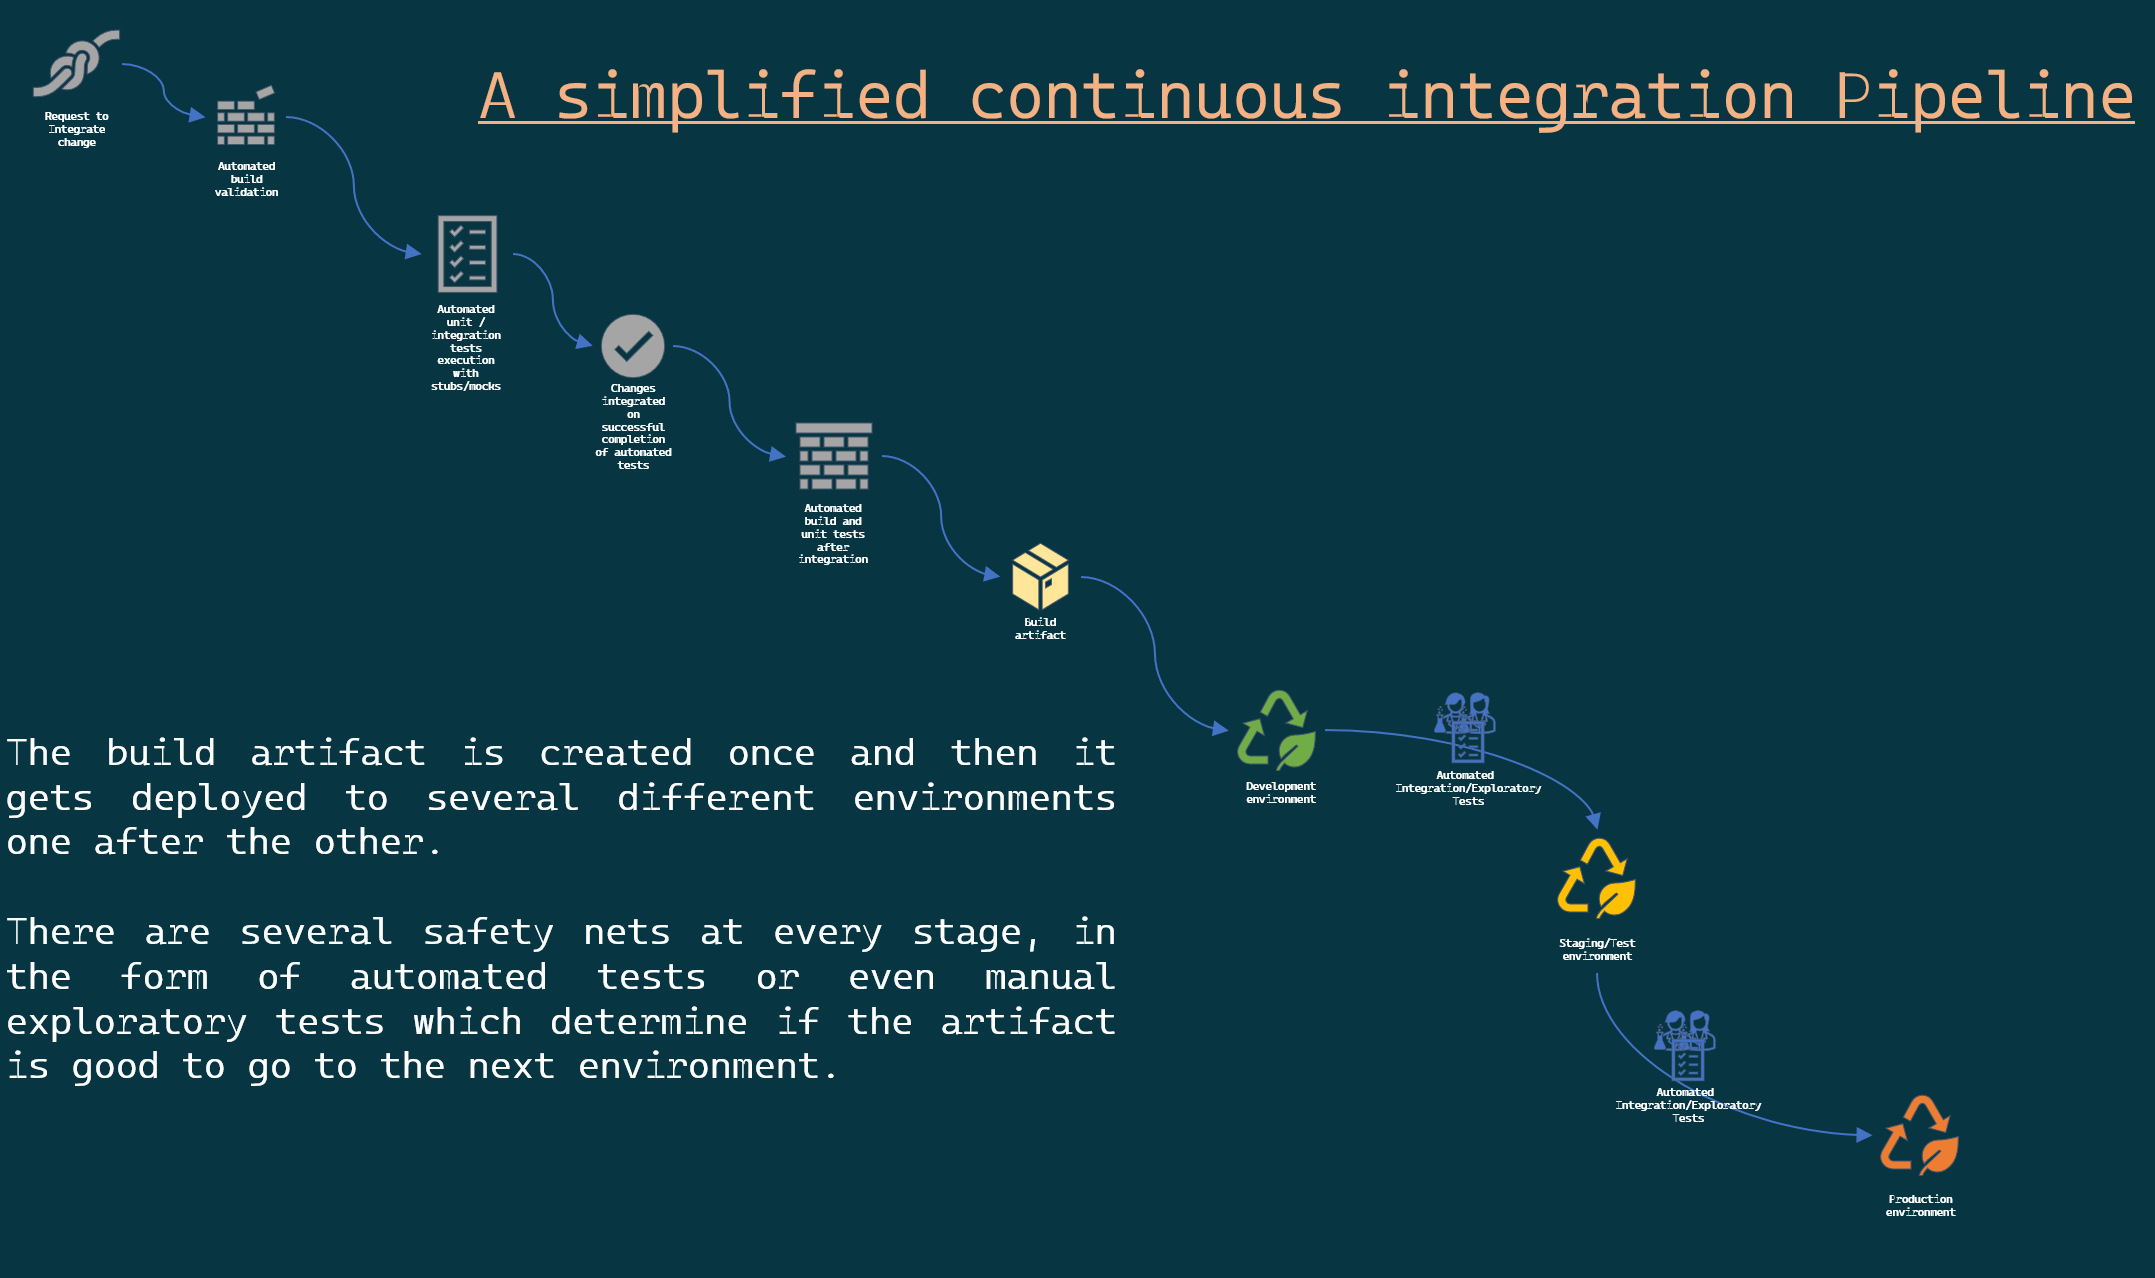
Similarly, in the example pipeline, you already see that we have safety nets of integration and exploratory tests before he artifact is deployed to the subsequent environment. Any failure of these tests tells the team that something unexpected has happened, and someone should take a look at the most recent change as to why the test failed. Thereby ensuring that you fix problems as soon as possible.
Apart from unit tests, integration tests, and other tests, any other measure you introduce in the pipeline to check whether your code is moving in the right direction is completely dependent on what your team or organisation considers important. In our team, code quality is of utmost importance, hence we decided that we needed a way to see how our test code coverage performs over time.
And that’s when we decided, we need to invest some time, in creating some code coverage reports as part of our pipeline. A simple idea that can easily be done today, thanks to several tools and utilities created by individuals and groups who have already traversed this path before.
Let me share how we did it.
Show me the pipeline code
We use Azure DevOps Pipelines for our continuous integration. So things might look different if you have your code on GitHub and use GitHub actions or if you use some other continuous integration solution.
We make an effort to ensure that all our pipelines are written as code, in YAML. The pipeline changes can be committed and reviewed just like other code. The only problem is that you cannot locally test your build pipeline because, there is no tool yet, that allows you to do a dry run on your yaml locally. But we can live with it for now.
If you are not familiar with YAML pipelines on Azure Devops, please read about it from Microsoft Docs. Explaining that here is beyond the scope of this article.
The details
Generally a pipeline is composed of a Build stage which generally includes building and then running some unit tests and potentially publishing unit test results in some format.
In this case, our project is a dotnet core project. The steps we perform are:
- Build the solution in release configuration
- Run unit tests collecting code coverage results
- Install a coverage report generator tool
- Run report generator tool on the code coverage results generated by the tests
- Publish the code coverage port in a certain format
How do we collect test code-coverage?
Corbetura is a free tool that calculates the percentage of code accessed by tests.
Coverlet is an open source project on GitHub that provides a cross platform code coverage framework for C#. It is part of the .NET Foundation and it collects Corbetura coverage test run data which is then used for report generation.
In the YAML file, you’ll notice a line that reads:
--collect:"XPlat Code Coverage"
passed as arguments to the DotNetCoreCLI@2 task. The “XPlat Code Coverage” argument is a friendly name that corresponds to the data collectors from Coverlet. This name is required but is case insensitive.
Report Generator is an open source report generator on GitHub that converts reports generated by several different code coverage tools into human readable formats: tables, pie-charts etc.
The yaml contents
| |