I realised recently that I have always taken application logging for granted.
In my previous firm, which was a pretty large company, over a few thousand employees, we had a centralised logging platform and some lovely packages for each language and a team to configure the logging instance for our application and all that luxury.
Developers, did just application development. For everything else, there was always somebody you could lean on. So the good thing was, you could spend all your time, polishing your code, applying all sorts of clean-code principles and achieve some coding nirvana and focus on just the business logic and the core problem.
The downside: you don’t learn about anything else. You have no idea, how these log instances or platforms are configured. You have no clue, what goes behind that decision making or even how to set it all up. It is all neatly abstracted inside the library that is maintained by the central logging platform team!
Great stuff! I mean, every company should aim to get there. But when you are learning to build applications, it is actually better to get your hands dirty with some setup and configuration and all sorts of messy stuff. This gives you perspective that you’d otherwise never get anywhere else.
So now, in my current firm, I am presented with an application which unfortunately is not yet widely used by any client, as it is pretty much under development. So that’s when it hit me that I have never configured a simple log instance or even thought about how to set it all up from scratch. Luckily we have some Azure admins, who are like walking-talking google results pages for our silly questions about such things.
We developers tell them that we need to start logging some telemetry and audit information. They then ask a bunch of questions and guide us through the process. It is pretty straightforward to get started.
So what is Application Insights?
It is an application performance management service for anyone who develops and maintains an application on Azure. You can use it to monitor your application and detect problems early and is also pretty easy to setup and log into from multiple different platforms, including .NET (this has to be there), Node, Java, and Python applications. You can even monitor and analyze telemetry from mobile apps by integrating with Visual Studio App Center! This last bit, is something I am really keen on investigating. But for this blog post and series, I’ll focus on just the metrics from a .NET Core web application
What can it do?
It monitors a whole load of things, if you choose to:
- incoming requests and outgoing responses and times, and rates and failures - combine it with alerting and you are setup!
- all those information for dependencies of this app - database, http requests to other apps in the cloud and helps you identify if slowness is because of this dependency
- Exceptions - come on, if it didn’t do this, then, there wouldn’t be a point using something like this
- Page views and load performance - something you can do by hooking your UI to app insights
- Performance counters - cpu, memory, network usage, etc
- Diagnostic trace logs - useful to track down a request from the gateway all the way to several other dependencies downstream and connect it all together
- Custom metrics/events - you can track your business events - bought a service, ordered a coffee, whatever your event is
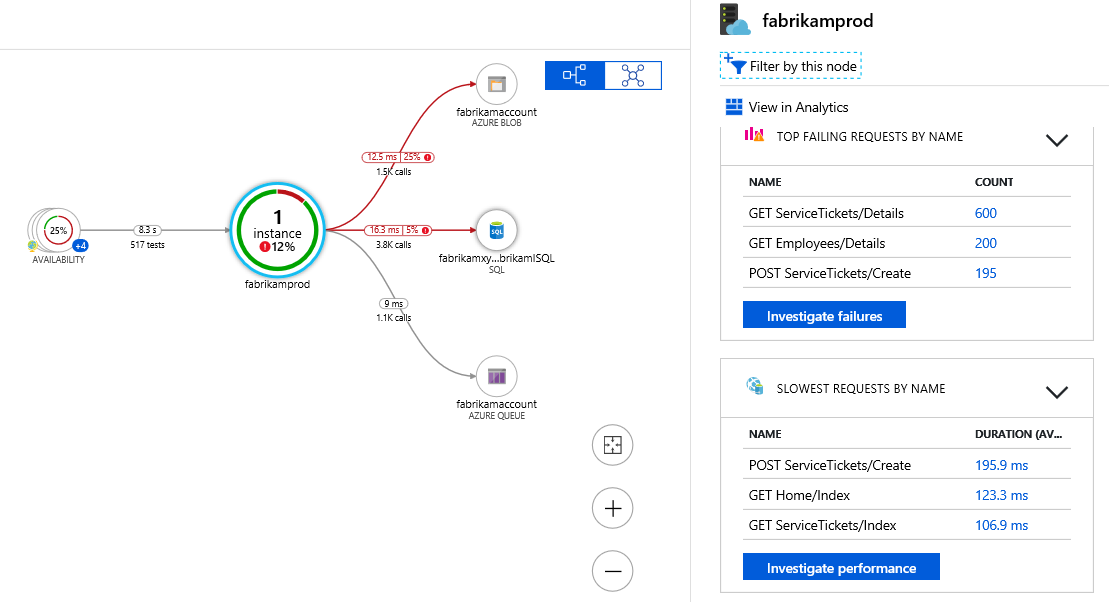
One of the most useful bits of application logs is the Application map it creates:
I’m sure other cloud platforms have very similar stuff, after all, Azure is probably the new kid on the block and Microsoft has only recently made itself cross platform, so Azure is still probably catching up with the likes of AWS and GCP etc. My opinion only as I come from a Linux background.
What then is SeriLog?
You have probably already done logging in dotnet using Log4Net or NLog or whatnot. I have personally used both in different projects.
SeriLog is relatively a new kid on the block. And it builds on the same sort of functionality that every logging library already provides. But it is easier to setup, has a cleaner API (fluent configurations are lovely) and works on .NET Core and .NET framework. Great right!? Unimpressed? Well I haven’t really told about the cool stuff yet.
The project’s website also claims that it is built with structured event data in mind.
When I first saw that line, it didn’t make much sense. But as I read further into it, I saw how useful it was!
Structured Logging
I am going to try and explain this idea a bit and why it is useful.
When you generally log information somewhere, you tend to log information like:
- the event that occurred
- the date and time it happened
- ip address, host, node numbers, machine name
- user related information, userid, email who resulted in the event
- the name of the app/function etc that logged it
- the severity - warning/error/info etc.
But this can be done as long concatenated strings in some back-end store. After all, we just need the information written down somewhere which we can search through to understand what happened.
Well, what is even better, is the information being logged had a predetermined structure, which would make it much easier for app developers to search through their logs as they would be searching through structured data instead of strings. How about that?
Structured logging frameworks or libraries take in textual log messages and formats it into a specific structure, like an object with properties which would then make it much easier to search through logs without having to rely on crazy regular expressions.
How to put them together?
You can get your application to dump basic telemetry into Application Insights, without any additional library. To be honest, you don’t even need to write a single line of code. You can turn on logging on Azure portal, as long as you have the admin privileges and obviously a valid subscription and an app service plan.
And you could also set it up using code, without any additional third party library, by following the official docs - How do I use Application Insights?
However, what you get for free is basic telemetry data. Application insights cannot guess what your business event is. It doesn’t know what your domain logic is all about. It will log everything that it considers has to be logged, which you obviously have chosen as necessary, either through azure portal configuration or some configuration in your application.
That’s where you need to use a library like Serilog to take control of some structured logging.
How do we marry Serilog and AppInsights in .NET Core
An overview of steps:
- Put configuration for Serilog and Application Inisghts in your config file -
appsettings.json - Do some fluent service additions in your Startup file
- Setup HostBuilder with Serilog and Telemetry again, using fluent api and potentially some reading from configuration file
- Run your application and check if it is logging
That’s all there is to it!
Where is the code and configuration?
Let us begin with the appsettings.json or corresponding environment version of it, appsettings.Development.json or whatever you use.
| |
Now that you have put some settings in the file, you obviously want to understand what it is.
So appsettings.json would have all of your necessary application settings. Some people these days, use environment variables instead of using a settings file. But in this example, I am using a settings file approach. Let us delve deeper into the logging configuration.
The "Logging" property is the default .NET Core logging settings. You can configure default log settings here.
"LogLevel"property in the above json, applies all enabled logging providers. It specifies the minimum level to log for a selected category.Trace= 0,Debug= 1,Information= 2,Warning= 3,Error= 4,Critical= 5, andNone= 6.
- The
"Default","Microsoft","Microsoft.Hosting.Lifetime"properties are different log categories"Microsoft"category applies to all categories that start with"Microsoft"and we have set it up such that only"Information"log level and above are logged."Microsoft.Hosting.Lifetime"category is a more specific category than the earlier"Microsoft"category. And you may choose a different log level here, but I chose"Information"again.
- You may add further providers like a
"Debug","EventSource","EventLog"and many other providers . But here we are not going to configure any further providers. You can read more about logging providers in .NET in the docs. - In the
"Serilog"property, I’ve configured very similar information. Notice how Serilog has used better naming of properties to make it clearer it is indeed, the"MinimimumLevel"of the log that we are setting up. Any categories that need a lower level can be overridden, using the"Override"property and specifying the categories and corresponding log levels. - In the
"ApplicationInsights"property, we have just specified two properties.- The
"RoleName"which we can set to any value that we’d like to see as the name of the node of our application shown in the application map. - The
"InstrumentationKey"is the unique identifier of the application insights resource where you are sending your instrumentation data or telemetry. You can get this from Azure portal when you configure an application insights instance
- The
So I guess, that’s all the settings sorted in the settings file.
But wait! You need to install the nuget packages to get Serilog and Application Insights in your app. Go download the following nuget packages, whichever is the version that works with your aspnet core app:
"Microsoft.ApplicationInsights.AspNetCore""Serilog""Serilog.AspNetCore""Serilog.Sinks.ApplicationInsights""Serilog.Sinks.Console"
Startup.cs has some configuration too
| |
Let us explain what is going on in our Startup.cs. We have access to an instance of the application IConfiguration instance, which will help us to access some of the application settings.
In the ConfigureServices method:
- Setup SeriLog’s globally shared Logger instance using
services.AddScoped(f=> Log.Logger) - Setup
AppInsightstelemetry with the configuration object -services.AddApplicationInsightsTelemetry(Configuration) - Tell
AppInsightswhat your cloud role name is by using a custom telemetry initialiser -services.AddSingleton<ITelemetryInitializer, ApplicationInsightsRoleNameInitialiser>(). We will take a look at what it does. It is based on something I found on Stackoverflow. - In the
Configuremethod, we then setup theSerilogRequestLoggingmiddleware. To quote what the Serilog documentation says as I cannot explain it any better- Adds middleware for streamlined request logging. Instead of writing HTTP request information like method, path, timing, status code and exception details in several events, this middleware collects information during the request (including from Serilog.IDiagnosticContext), and writes a single event at request completion. Add this in Startup.cs before any handlers who activities should be logged.
This last fluent configuration of the Serilog middleware, run in the request handling pipeline outside of the ASP.NET Core MVC pipeline and doesn’t include MVC-specific details like ActionId or ActionName apparently. Read more about how to configure these in Nick’s blog post.
Now let us jump into the Telemetry Initializer that we introduced.
| |
All that this does is: read the ApplicationInsights:RoleName property from the settings file and ensures that our application’s name appears the way we want it to be. By the way this can come from any setting field. I just chose a name that made sense to me.
That was easy! Is that it? Nope. We do have to setup some stuff at application initialisation in Program.cs
| |
Let us now deep dive into the configuration changes above. We want the application to start logging to Application Insights, using Serilog from the very beginning of the app, right when the application builder is going to build the application from the configuration. This is why we made the changes to Program.cs in the first place.
- At line 10, we read configuration loaded from appsettings.json, will share what’s behind the ConfigurationHelper right after this.
- Then we create a default
TelemetryConfigurationinstance as recommended by Microsoft - We then pass the instrumentation key to this configuration instance
- In line 15, we initialise, Serilog’s globally shared logger from the application settings configuration that was read earlier and using the fluent api for configuration, we set a minimum log level, and call
Enrich.FromLogContextwhich enriches log events with properties fromSerilog.Context.LogContext - Then we configure the Sinks, the places where are logs finally sink. In this case, it is Console and Application Insights. And to the
ApplicationInsightswe ensure we pass thetelemetryConfigurationobject that we created earlier and also ensure that are Logs are Traces and not Events in this case. In case you wanted to know the difference, check the issue discussion on github which leads to the corresponding official docs pages on Events and Traces respectively. - Then in Line 24 we start logging!
- In the HostBuilder Configuration, we then call
UseSerilogto set Serilog as the logging provider.
Now for the ConfigurationHelper. It is just a class to help read from the appsettings file.
| |
This class helps read the corresponding appsettings.json and also read from corresponding secrets file for local development. Not essential, if all you use is appsettings.json. You could potentially put the two lines in the same Program.cs. Totally up to you though.
Now, you may run your application and you’ll see logs being printed on your console! It is pretty simple to start with. But gathering all this information in one place was the hard bit for me, I had to keep cross referencing docs to find answers, mostly answers to what does what and why.
I hope this was useful. Happy logging!
PS: I have posted another article that solely focus on Application Insights with just links to a youtube video and docs